Automated Trading Analytics & Dashboards
Ditch the broken spreadsheets. Stop spending hours calculating your Risk/Reward ratio. Log your trades and let The Firm instantly generate professional analytics to show you exactly where your edge is.
Your Complete Trading Performance Tracker
Excel is dead. Instantly see your Win Rate, Average R:R, Profit Factor, and Max Drawdown without writing a single formula. Beautiful, clear dashboards that give you the full picture.
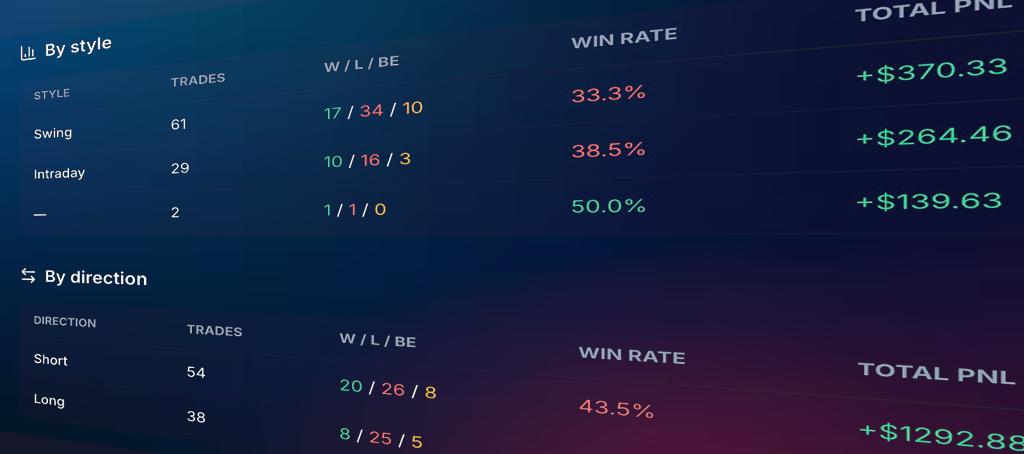
Filter by Setups, Tags, and Days
Are you a profitable trader on Tuesdays but terrible on Fridays? Does your "Breakout" setup actually work? Filter your entire history by custom tags to find your most profitable conditions.
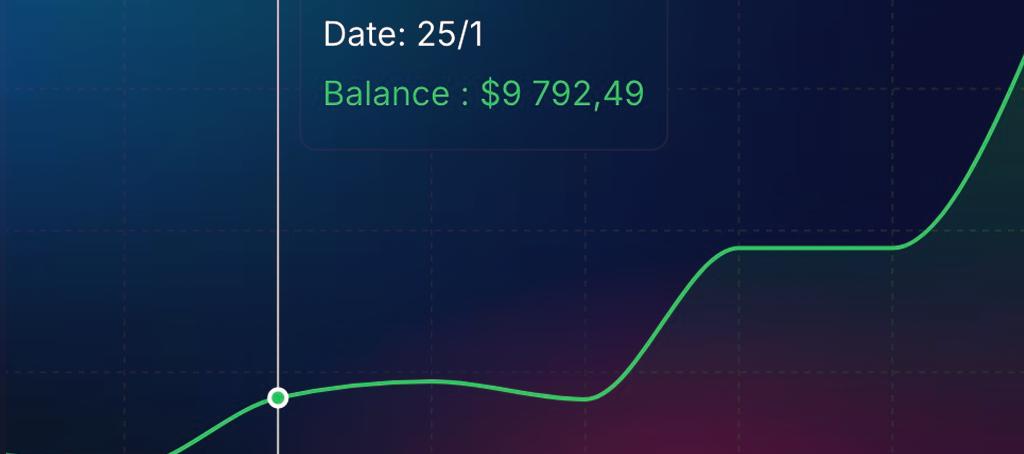
Track Your True Equity Curve
A rising PnL doesn't mean you're a good trader if your drawdown is massive. Visualize your equity curve and account growth smoothly, identifying periods of tilt before they blow your account.
Track the metrics that actually matter
Ready to see your trading clearly?
Data drives profits. Upgrade your analytics and start treating your trading career like a data-driven business.